
Case Study
From freight broker to intelligence partner: a multi-tenant analytics SaaS
Most freight brokers hand clients a rate, a tracking link and an invoice. For R&R Global Logistics we built a live intelligence portal instead — on-time performance, lane volatility scoring, shipment-pattern monitoring, and an AI layer that reads freight email threads and converts them into structured operational signals.
01
The Challenge
R&R Global Logistics — the freight brokerage whose website we rebuilt — came back with a harder problem. Their clients' logistics managers and supply-chain directors had effectively zero visibility into how their freight was actually performing. The industry norm is a rate, a tracking update and an invoice: no performance transparency, no risk insight, no context for why costs move.
The second gap is quieter and worse. The changes that decide whether freight arrives on time — pickup reschedules, delays, urgency escalations, rate approvals — live buried in email threads between agents, shippers, consignees and warehouse teams, invisible to any dashboard. Most freight analytics tools only ever touch the structured TMS data.
The brief for the RRGLS Freight Intelligence Platform was to close both gaps at once: structure the shipment data and mine the communication layer where most freight problems actually begin — turning a transactional broker into a strategic logistics partner.
02
The Approach
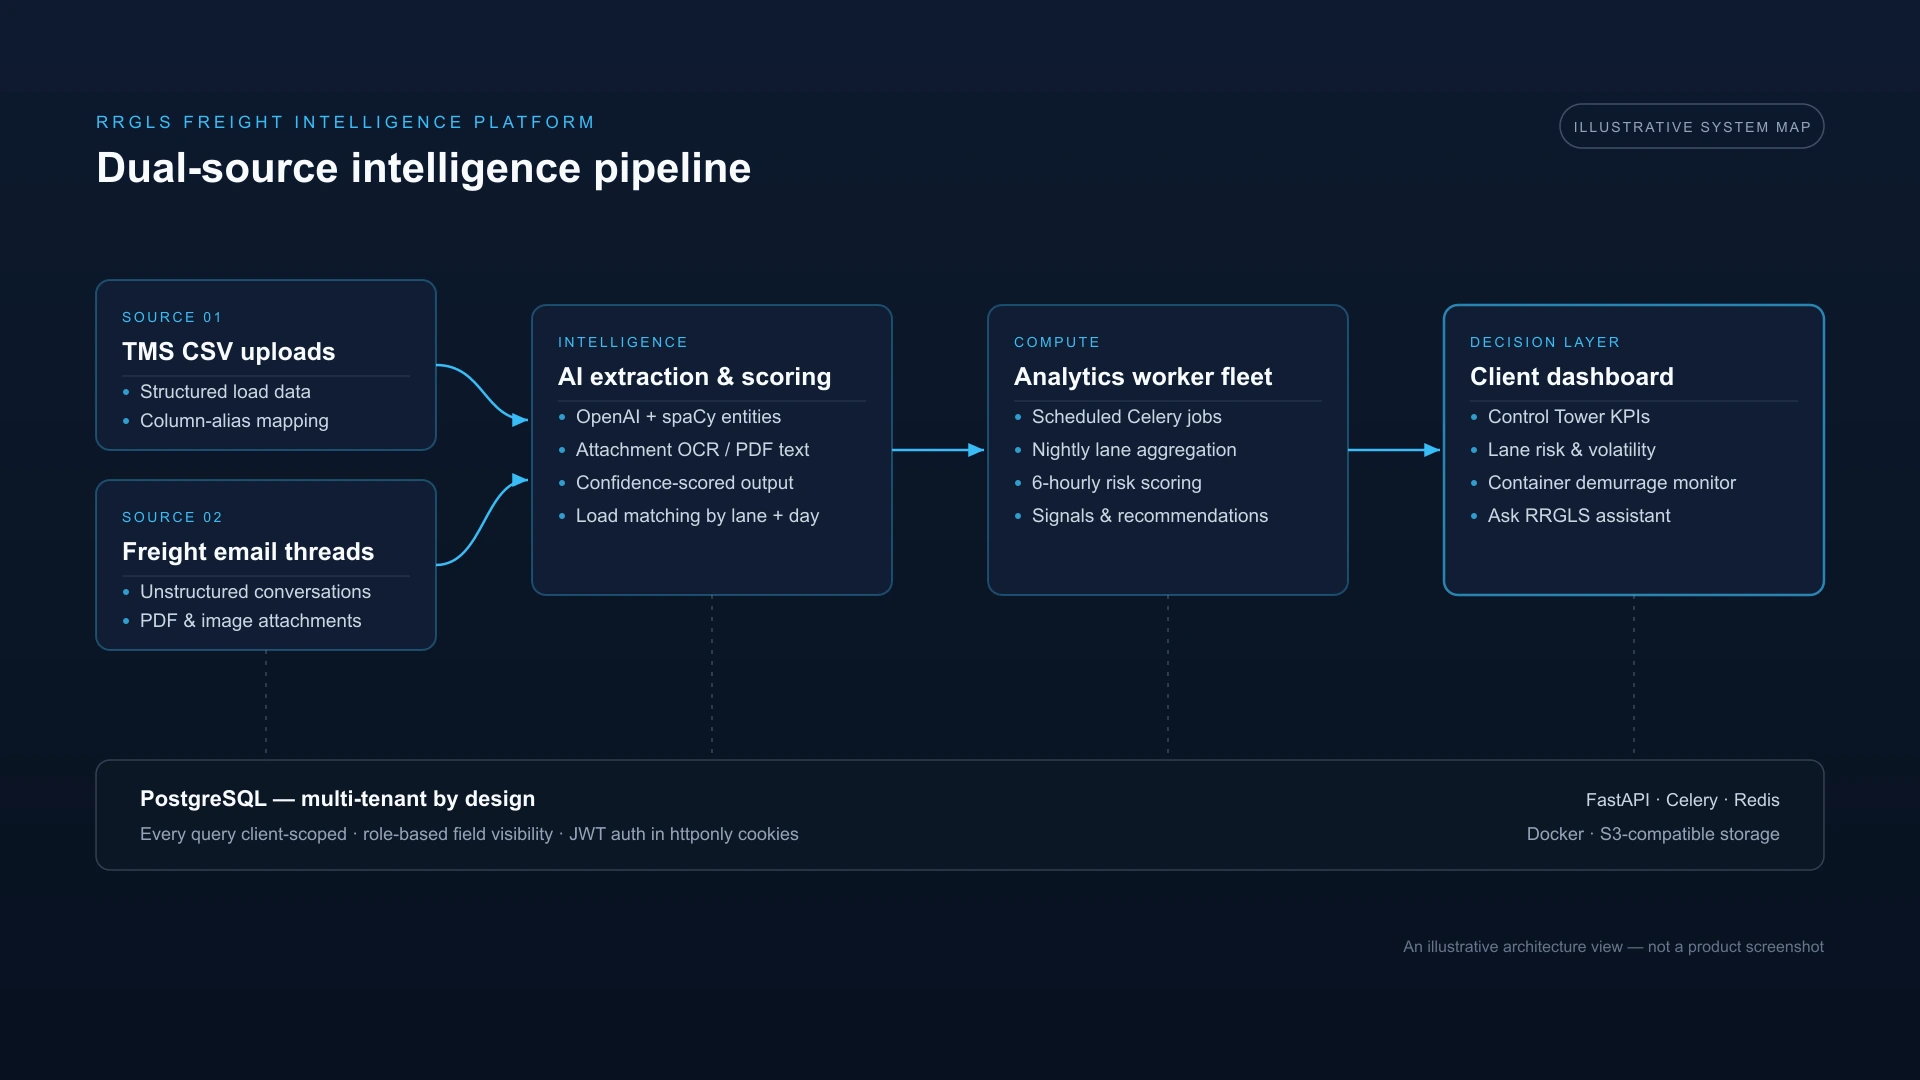
We designed and built the platform as a multi-tenant B2B SaaS: a Next.js and TypeScript front end over a Python FastAPI backend, PostgreSQL underneath, and a fleet of scheduled Celery workers on Redis doing the heavy thinking in the background. Three engineering problems shaped every decision:
Two sources, one truth
Structured TMS CSV uploads and unstructured freight email had to merge into a single model — with dry-run validation on import, and sensitive commercial fields protected from ever being overwritten.
AI you can audit
Every extraction the email engine makes is confidence-scored and traceable end to end, so an operations team can always see why the dashboard believes what it believes.
Answers before the question
Scheduled workers continuously pre-compute lane risk, shipment patterns and recommendations, so dashboards read finished results instead of crunching data on request.
The email intelligence pipeline is the flagship. With client authorization it connects to a designated freight inbox, thread-matches conversations, extracts shipment references and operational changes with OpenAI and spaCy, processes PDF and image attachments through text extraction and OCR, scores every extraction for confidence, and matches emails to TMS loads by lane and pickup day. It reads only freight-related threads — it never sends email and never alters a record on its own.
03
The Solution
Clients sign into what amounts to a control room for their own supply chain. The Control Tower leads with the questions a logistics manager actually asks — on-time delivery, cost-per-mile trends, lane volumes and top lanes by spend — over a live shipment table and a lane-risk heatmap. Each lane carries a Low / Medium / High risk score built from recent rate movement, 30-day trend direction and capacity signals, and a market-education layer explains in plain language why rates are moving: seasonal capacity, fuel impacts, regional congestion.
- Real-time performance dashboard (on-time %, cost/mile, lane spend)
- Lane volatility & risk scoring engine
- Shipment-cadence and lead-time monitoring with variability alerts
- AI communication-intelligence layer (email → structured dashboard signals)
- Container demurrage countdown & risk monitoring
- Conversational "Ask RRGLS" data assistant
- Strict multi-tenant isolation + role-based access control
Around the core sit the working tools: per-carrier performance profiles and scoring, an order-management and OTIF view with an email-exception workbench, AI-refreshed operational recommendations, CSV report exports, and Ask RRGLS — a conversational assistant that answers questions about the client's own freight data. An admin panel gives R&R's operations team full system visibility, down to an email-simulation inspector for tracing exactly what the AI extracted and why.
04
Security & Scale
A platform holding freight rates and revenue data for multiple client companies has no room for "mostly isolated." Tenancy is enforced at every layer: every query is scoped to the client, all mutation endpoints are admin-guarded, and three roles govern not just which pages a user sees but which fields — revenue, cost and carrier contact data are stripped from client-viewer responses at the API itself. Authentication is JWT in an httponly cookie, with bcrypt hashing, an invite flow and rate limiting.
-
Isolation at every layer. Client scoping in the database, the API and the UI — a tenant can only ever see its own freight, enforced where it can't be bypassed.
-
Roles decide fields, not just pages. Field-level visibility means the same dashboard safely serves a client viewer, a client admin and R&R's own team.
-
Shipped like a product, run like one. The full stack — PostgreSQL, Redis, FastAPI, Next.js, Celery workers and object storage — runs as a health-checked Docker deployment, with the email pipeline syncing on a daily schedule. The platform is in production and actively developed, with new carrier-tracking and communications integrations built as pluggable pipelines, switched on as live credentials land.

Collaboration
Got a project?
Let's talk.
We're a team of creatives who are excited about unique ideas and help companies to create amazing identity by crafting top-notch UI/UX.